Mismatching Inventory Paints a Detailed Picture of the Market
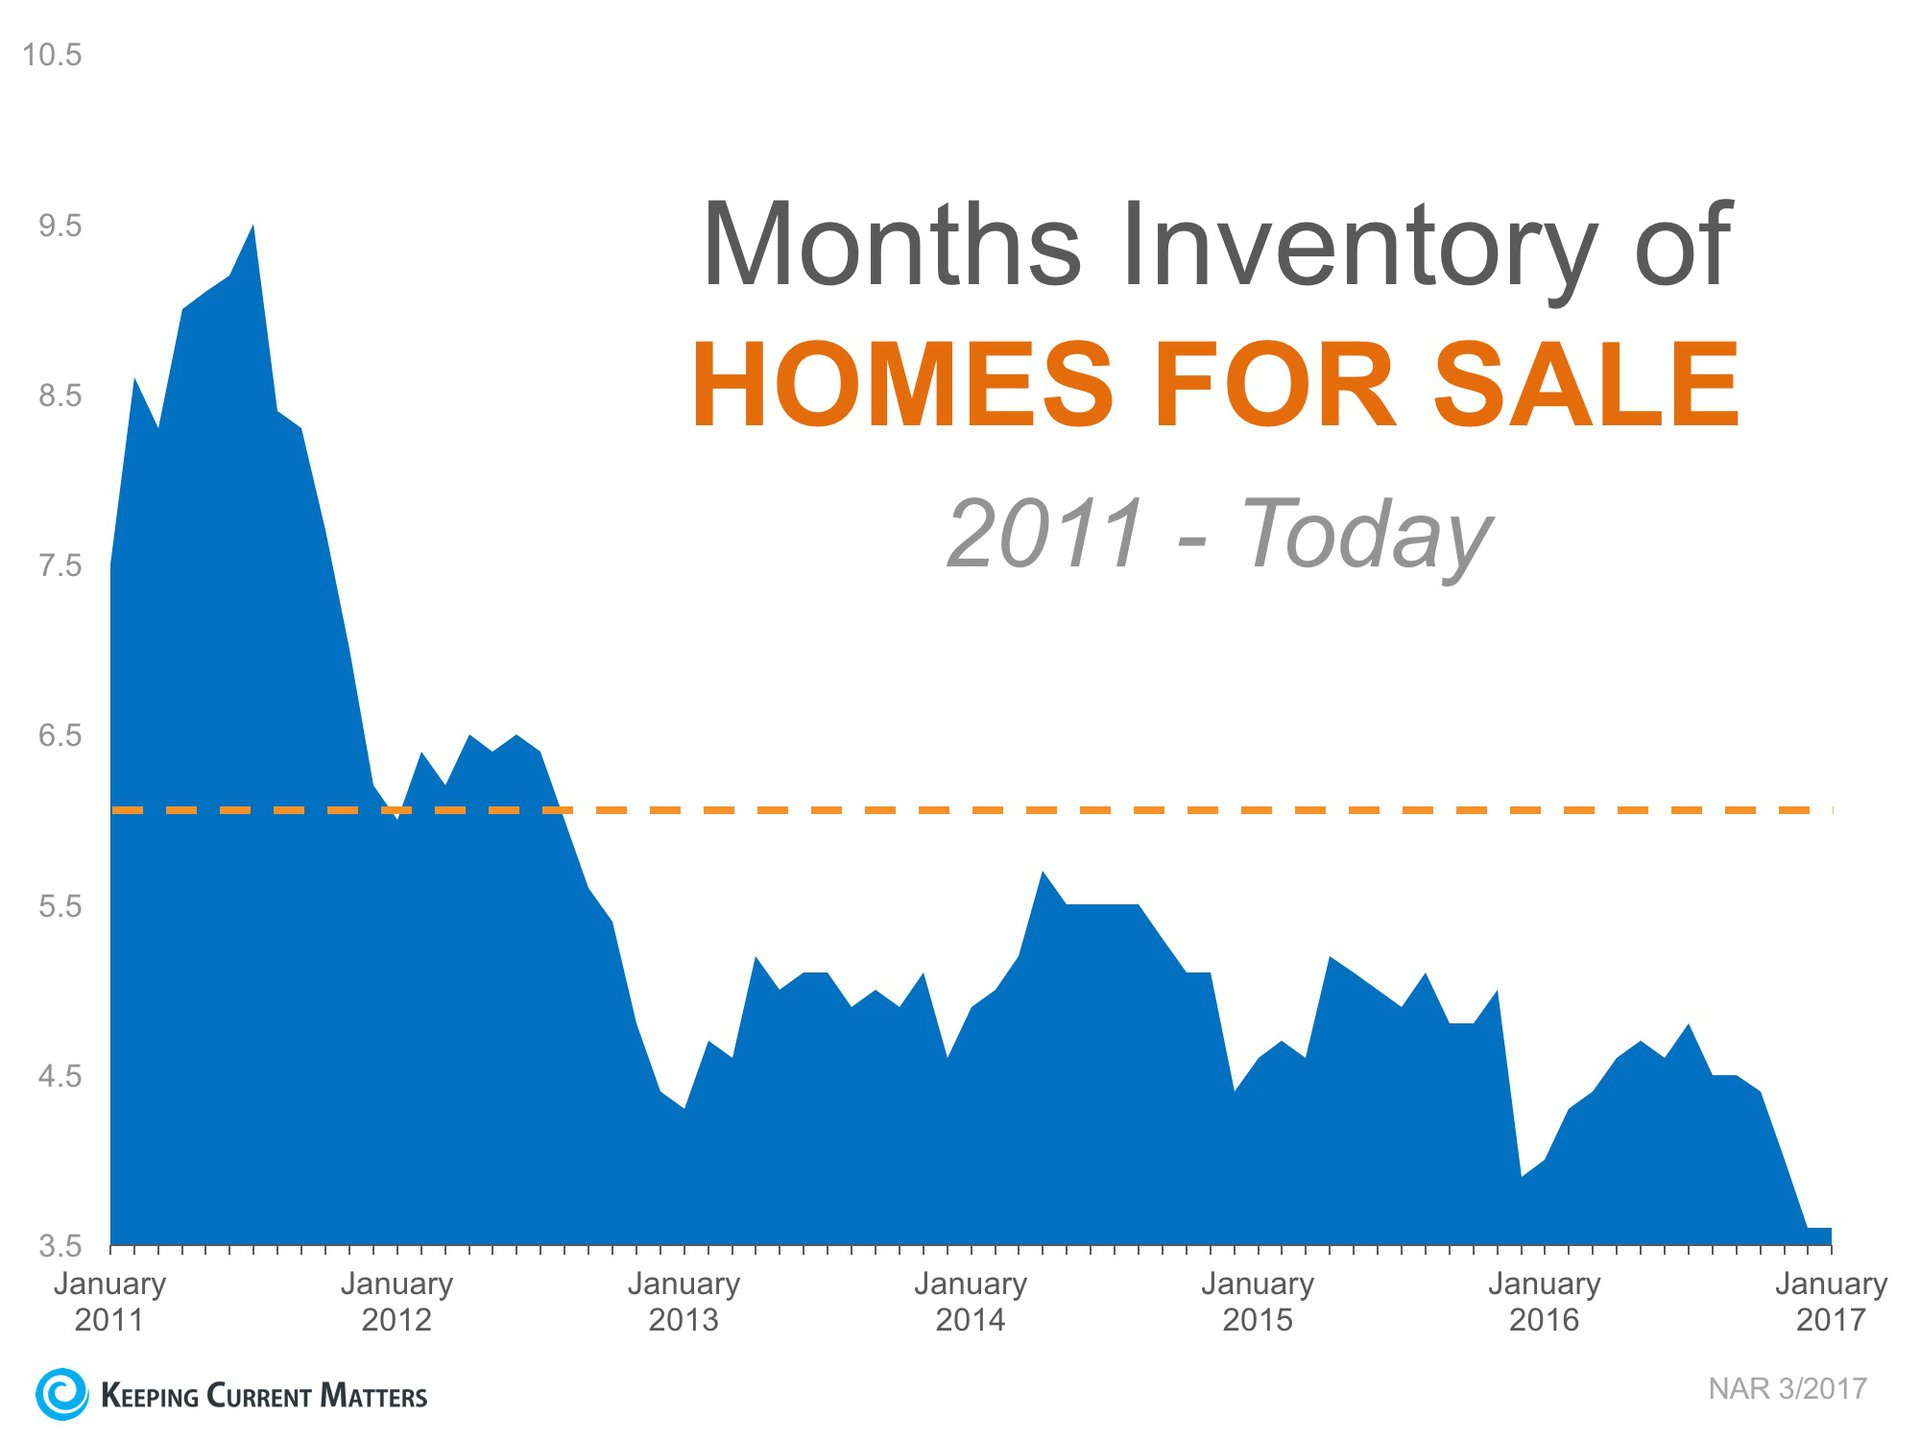
The inventory of homes for sale in the present market was recently reported at a 3.6-month supply. Inventory is currently 7.1% lower than it was the same time last year. This marks the 20th consecutive month of year-over-year drops.
According to historical records, inventory should be at a 6-month supply in order to be considered a normal market while home prices appreciate with inflation. Less than a 6-month supply is considered a sellers’ market, wherein demand for houses outweighs supply, increasing prices.
The chart below shows that since August 2012, the United States has been in a sellers’ market, and last month’s numbers reached a new low.
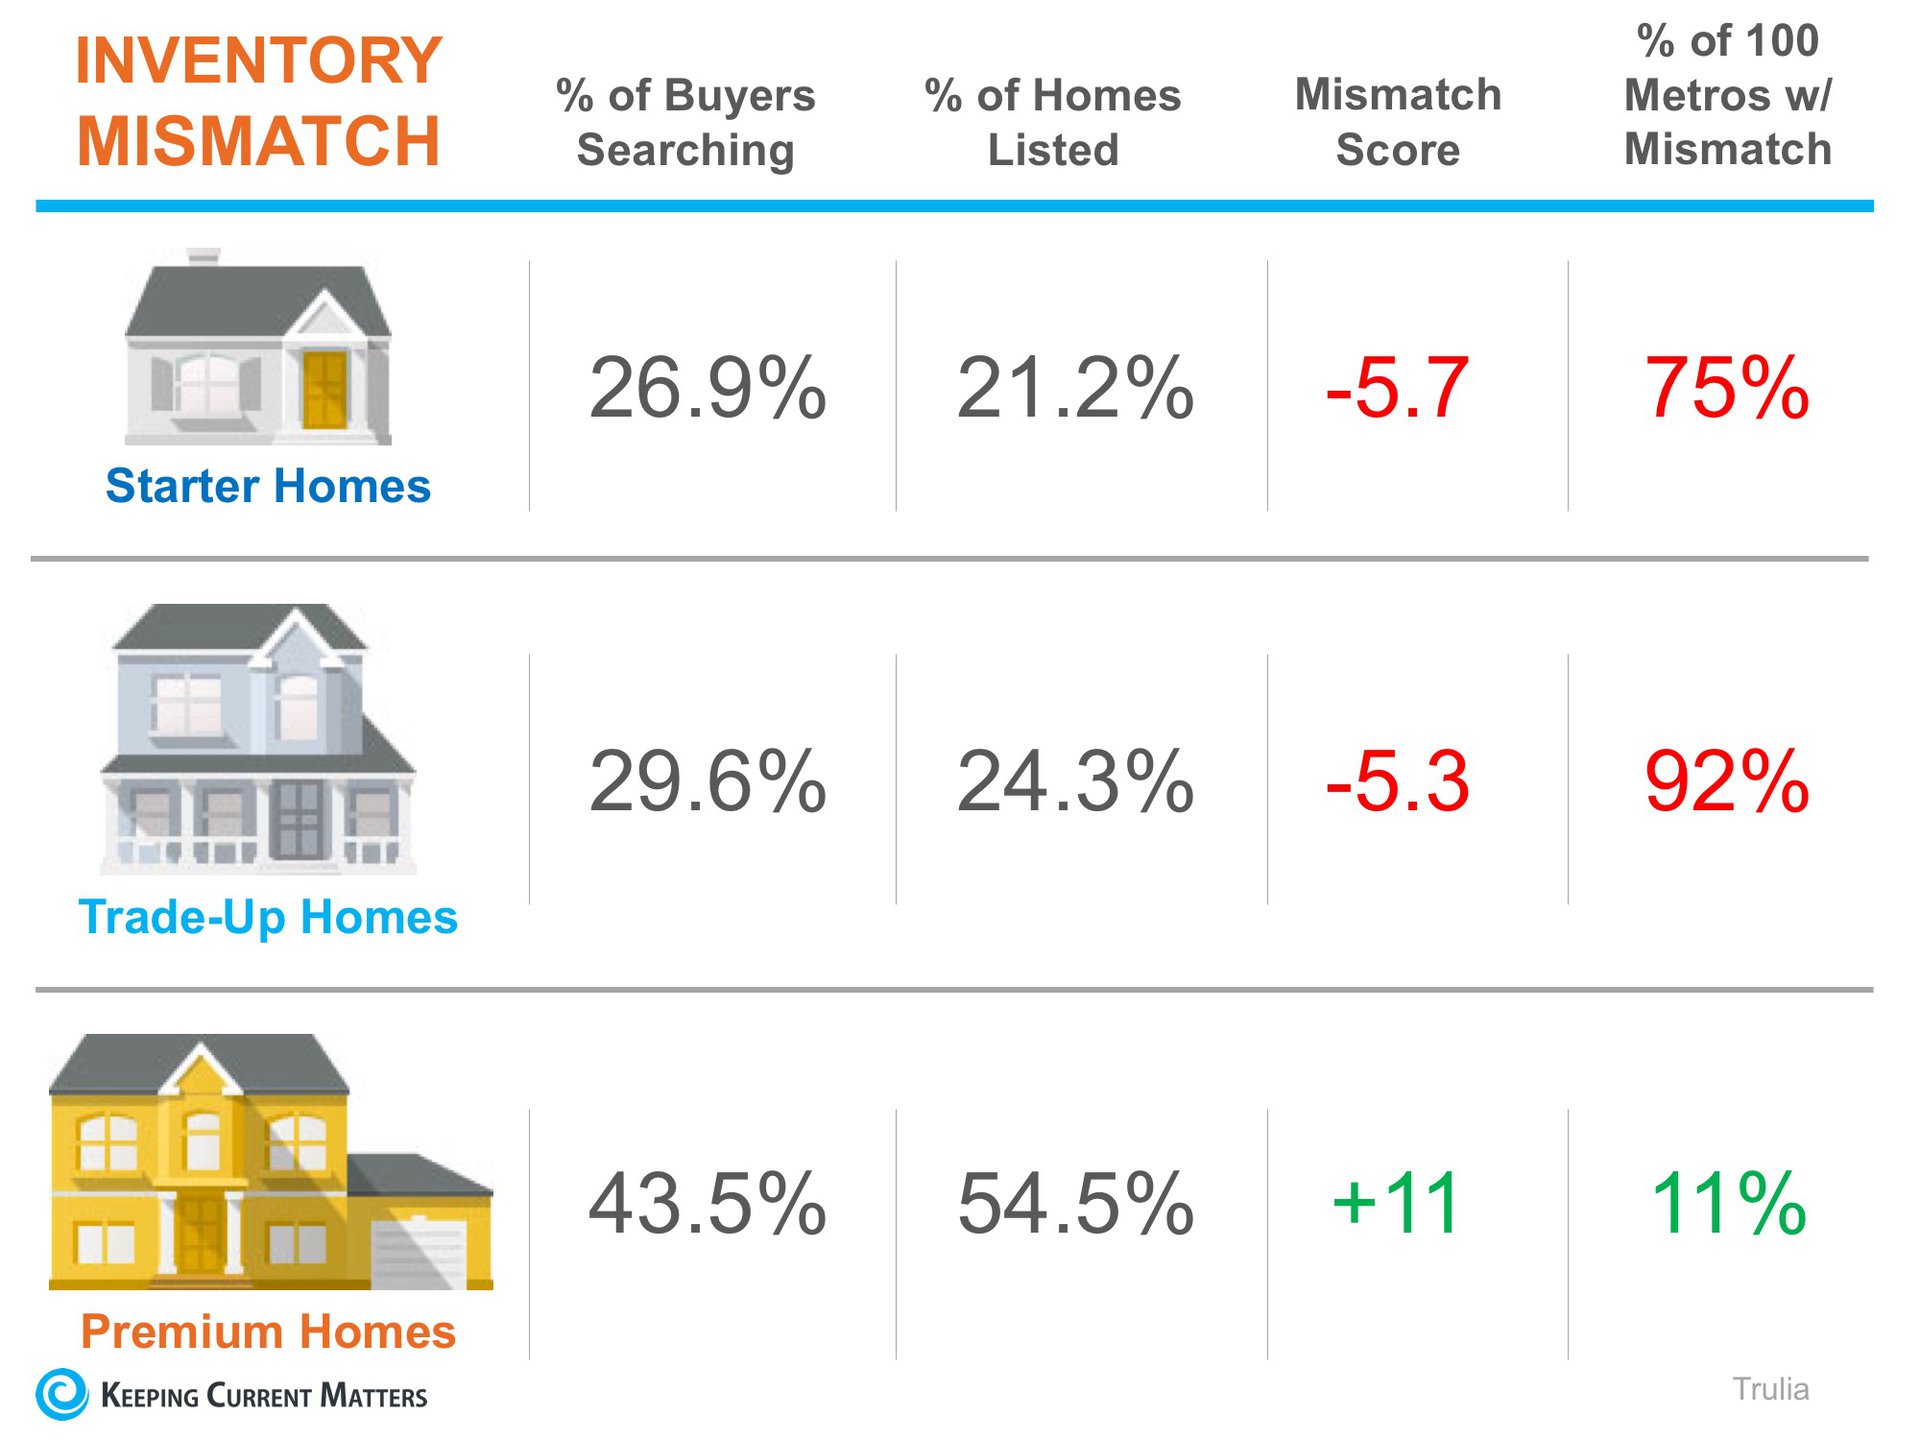
Recently Trulia revealed that not only is there a shortage of homes on the market, but available homes for sale are not meeting the needs of buyers who are searching.
Homes are often segmented into three groups by price range: starter, trade-up, and premium.
"Trulia’s market mismatch score measures the search interest of buyers against the category of homes that are available on the market. 'If 60% of buyers are searching for starter homes but only 40% of listings are starter homes, [the] market mismatch score for starter homes would be 20.'"
The chart below has the results of their latest analysis.
On a national level, buyers are searching for starter and trade-up homes. Being that the inventory in these categories is low, it has resulted in a highly competitive seller’s market.
Homebuyers in the premium market have the least amount of competition and a surplus of listings from which to choose, leading to a buyer friendly market.
All this information has been on a local level, so in order to understand the local market, call us! We'd love to help in your real estate journey.
.png)
.png)


